Happiest & Unhappiest Places in the UK: Our 2026 Index
Happiest and unhappiest places to live in the UK
How do local conditions for wellbeing compare across the UK? Our original analysis ranks 357 council areas using official health, employment, earnings, air-quality and broadband data.
Four countries. One consistent method. This index measures selected local conditions—not residents’ reported happiness.
Council areas with every required measure.
4 areas excluded; reasons below.England, Scotland, Wales and Northern Ireland.
Country views use the same UK scores.Latest comparable council-level releases.
Observation periods differ by measure.Our ranking compares selected conditions associated with wellbeing. The separate ONS chart asks people how happy they felt the previous day. Neither tells us how every resident feels or predicts the effect of moving.
The highest and lowest scores in our UK index.
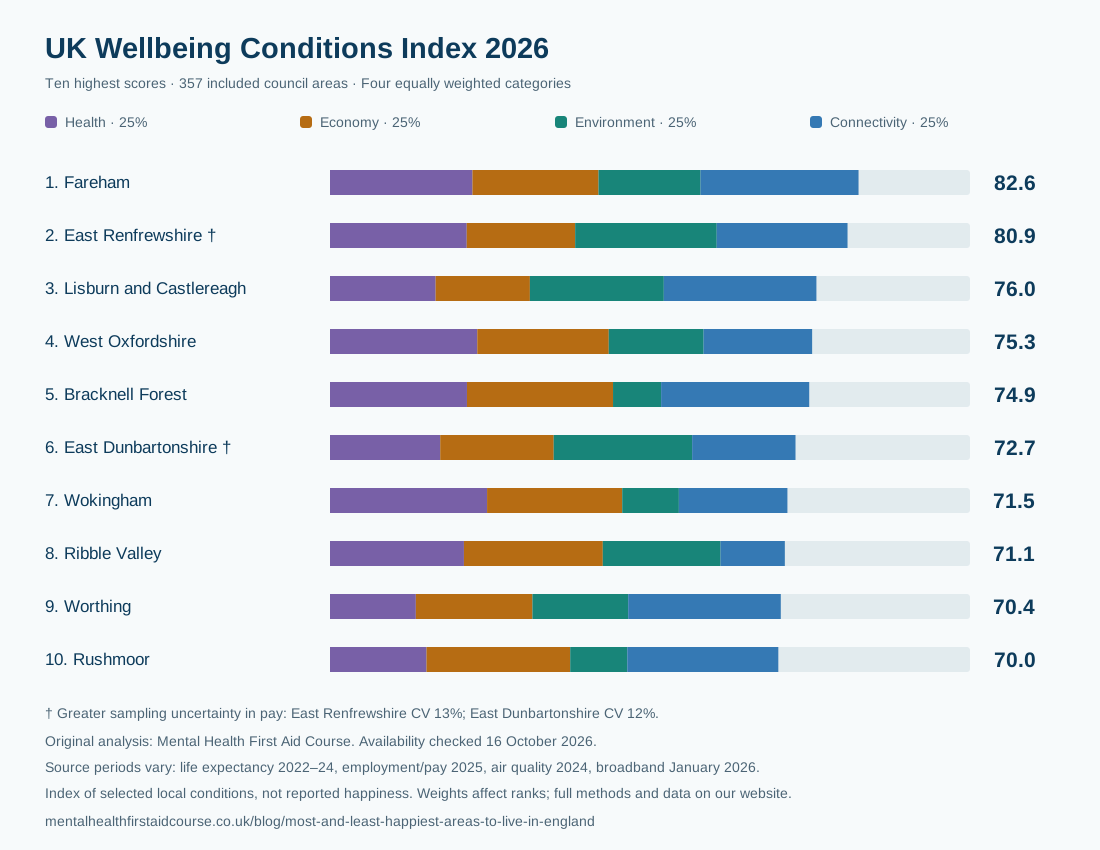
Our UK Wellbeing Conditions Index combines four equally weighted categories. Higher scores mean a more favourable combination of the selected measures, relative to the other included areas. These are our calculations from official data; the government does not publish or endorse this index.
Top 10 local areas
| UK rank | Local authority | Index /100 |
|---|---|---|
| 1 | FarehamEngland | 82.6 |
| 2 | East Renfrewshire †Scotland | 80.9 |
| 3 | Lisburn and CastlereaghNorthern Ireland | 76.0 |
| 4 | West OxfordshireEngland | 75.3 |
| 5 | Bracknell ForestEngland | 74.9 |
| 6 | East Dunbartonshire †Scotland | 72.7 |
| 7 | WokinghamEngland | 71.5 |
| 8 | Ribble ValleyEngland | 71.1 |
| 9 | WorthingEngland | 70.4 |
| 10 | RushmoorEngland | 70.0 |
Bottom 10 local areas
| UK rank | Local authority | Index /100 |
|---|---|---|
| 357 | East LindseyEngland | 20.0 |
| 356 | BostonEngland | 23.7 |
| 355 | TendringEngland | 24.7 |
| 354 | HastingsEngland | 26.1 |
| 353 | Merthyr TydfilWales | 27.9 |
| 352 | BassetlawEngland | 28.5 |
| 351 | SandwellEngland | 29.1 |
| 350 | ThanetEngland | 29.7 |
| 349 | Blaenau GwentWales | 30.1 |
| 348 | WalsallEngland | 30.5 |
Score out of 100; not a percentage of happy residents. Small score differences are not evidence of a meaningful difference in wellbeing. The coloured bars show each category’s contribution. See the weighting sensitivity alongside every area below.
† The pay estimate has greater sampling uncertainty (coefficient of variation above 10% and at most 20%). East Renfrewshire is 13%; East Dunbartonshire is 12%. This uncertainty is separate from the weighting tests, and close ranks are not established statistical differences.
One UK method. Four country views.
Country ranks are drawn from the same UK index. We do not change the weights or rescale the scores within each nation, so a score means the same thing wherever an area is located.
292 areas ranked
292 of 296 council areas have all required data.
| Country rank | Area | Score | UK rank |
|---|---|---|---|
| 1 | Fareham | 82.6 | 1 |
| 2 | West Oxfordshire | 75.3 | 4 |
| 3 | Bracknell Forest | 74.9 | 5 |
| 4 | Wokingham | 71.5 | 7 |
| 5 | Ribble Valley | 71.1 | 8 |
Lowest in this country’s included areas: East Lindsey (20.0).
Explore all England results →32 areas ranked
32 of 32 council areas have all required data.
| Country rank | Area | Score | UK rank |
|---|---|---|---|
| 1 | East Renfrewshire † | 80.9 | 2 |
| 2 | East Dunbartonshire † | 72.7 | 6 |
| 3 | City of Edinburgh | 66.9 | 17 |
| 4 | Shetland Islands | 62.5 | 42 |
| 5 | Midlothian | 62.1 | 47 |
Lowest in this country’s included areas: East Ayrshire (36.0).
Explore all Scotland results →22 areas ranked
22 of 22 council areas have all required data.
| Country rank | Area | Score | UK rank |
|---|---|---|---|
| 1 | Cardiff | 60.9 | 56 |
| 2 | Vale of Glamorgan | 59.6 | 71 |
| 3 | Monmouthshire | 57.5 | 93 |
| 4 | Newport | 57.1 | 96 |
| 5 | Flintshire | 53.8 | 127 |
Lowest in this country’s included areas: Merthyr Tydfil (27.9).
Explore all Wales results →11 areas ranked
11 of 11 council areas have all required data.
| Country rank | Area | Score | UK rank |
|---|---|---|---|
| 1 | Lisburn and Castlereagh | 76.0 | 3 |
| 2 | Ards and North Down | 67.5 | 15 |
| 3 | Mid Ulster | 66.4 | 21 |
| 4 | Antrim and Newtownabbey | 66.0 | 25 |
| 5 | Newry, Mourne and Down | 64.9 | 33 |
Lowest in this country’s included areas: Causeway Coast and Glens (54.0).
Explore all Northern Ireland results →† The pay estimate has greater sampling uncertainty (coefficient of variation above 10% and at most 20%). East Renfrewshire is 13%; East Dunbartonshire is 12%. This uncertainty is separate from the weighting tests, and close ranks are not established statistical differences.
Find your area and see what drives its score.
Search a council area, filter by country or compare the four categories. Click an area to see its original figures and source periods.
On smaller screens, scroll the table sideways to compare every category.
| UK rank | Country rank | Local authority | Index /100 | Health /100 | Economy /100 | Environment /100 | Connectivity /100 | Rank range* |
|---|
† Greater uncertainty in the pay estimate. Select an area for its coefficient of variation and available confidence intervals.
*Rank range across eight alternative weighting scenarios. This is a test of modelling choices, not a statistical confidence interval. Displayed scores are rounded; ranks use unrounded scores.
How happy do people feel across the UK?
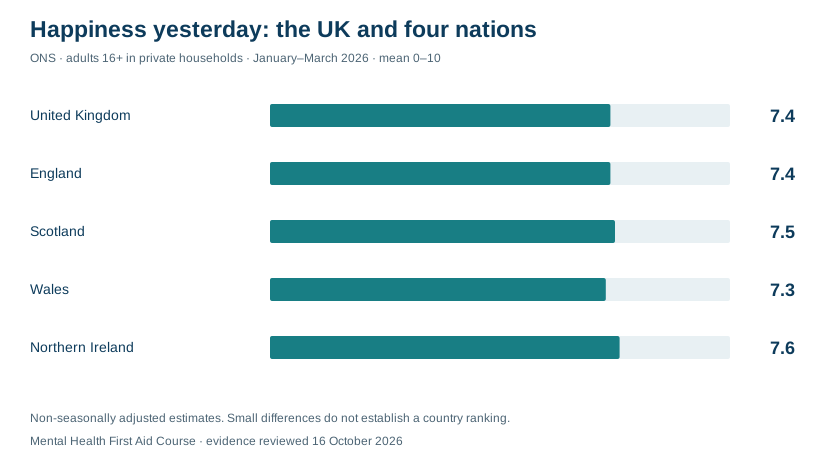
ONS asks how happy someone felt the previous day, from 0 (not at all happy) to 10 (completely happy). An average of 7.4 means 7.4 out of 10 across respondents. It does not mean 74% are happy, and it does not ask whether they are happy with their neighbourhood.
These survey averages provide national context. They are not inputs to our local conditions index.
Happiness yesterday
Mean score from 0 to 10 · private households · non-seasonally adjusted
The UK average, with variation behind it.
ONS asks: “Overall, how happy did you feel yesterday?” The UK estimate is weighted across the survey population; it is not the simple average of the four country means.
The country estimates use the same question and quarter. Small differences, however, do not establish that one nation is definitively happier than another.
Sample sizes, uncertainty and what the survey covers
Adults aged 16+ in private households; most communal establishments are excluded and no proxy responses are used. The estimates are non-seasonally adjusted. Compare the same quarter in different years when assessing changes.
| Geography | Mean | 95% interval | Sample* |
|---|---|---|---|
| United Kingdom | 7.4 | 7.4–7.4 | 24,600 |
| England | 7.4 | 7.4–7.4 | 19,640 |
| Scotland | 7.5 | 7.3–7.6 | 1,360 |
| Wales | 7.3 | 7.2–7.5 | 2,640 |
| Northern Ireland | 7.6 | 7.5–7.8 | 960 |
Means and interval endpoints are rounded to one decimal. A displayed interval of 7.4–7.4 reflects rounding, not zero uncertainty. *Samples are rounded to the nearest ten. Several intervals overlap.
APS outputs were designated official statistics in August 2026; they are not accredited official statistics. The withdrawal of the Scottish boost sample from January 2026 and older survey weighting remain relevant limitations.
The data, dates and calculation behind the rankings.
Why some of the latest data says 2024.
Official local statistics take time to collect, check and publish. Life expectancy pools three years to improve reliability. We use the latest comparable council-level releases available at our review date; this is a 2026 analysis of different reference periods, not a claim that every observation was collected in 2026.
| Measure | Data period | Publication | Why this release? |
|---|---|---|---|
| Male and female life expectancy at birth | 2022–2024 | 10 December 2025 | Latest published comparable UK local-area period verified at review. Three years are pooled to improve stability; this is period life expectancy, not healthy life expectancy. |
| Full-time employee median gross hourly pay, workplace basis | Pay period including 30 April 2025, provisional | 23 October 2025 | Latest common annual ASHE reference period verified at review. Workplace pay describes jobs located in the area, including commuters, rather than resident household income. |
| Employment rate, ages 16–64 | January–December 2025 | GB: 21 April 2026; NI: 30 July 2026 | Latest common annual district period across all four nations. GB alone has April 2025–March 2026; mixing that with NI calendar 2025 would compare different periods. |
| Population-weighted annual mean total PM2.5 | 2024 | Not specified in the local-authority source | Latest ready-made UK council population-weighted series listed. New 2025 modelled grids were released 9 October 2026, but require separate population/boundary aggregation and use a changed model. |
| Gigabit broadband availability at residential premises | January 2026 | 13 May 2026 | Latest published observed UK coverage snapshot verified. Availability is distinct from take-up and planned deployment. |
| Reported happiness, separate national context | January–March 2026 | 28 August 2026 | Latest quarterly non-seasonally adjusted UK and four-nation estimates at review; next release scheduled November 2026. Not an input to the local conditions index. |
Health
Male and female life expectancy at birth, given equal weight.
Life expectancy describes population mortality conditions, not a forecast for an individual.Economy
Median gross hourly pay for full-time employee jobs located in the area (including overtime), and the employment rate among residents aged 16–64, given equal weight.
Workplace pay describes jobs located in the area, including commuters. It is not residents’ income or spending power. Employment estimates come from a sample survey.Environment
Population-weighted annual mean total PM₂.₅ concentration; lower exposure scores higher.
A modelled measure of background air pollution, not a monitor reading at every home.Connectivity
Share of residential premises where gigabit-capable broadband is available.
Availability does not mean households subscribe, receive the advertised speed or can afford it.How we calculate the score
Each raw measure is converted to a percentile score from 0 to 100 across the 357 included UK areas: 100 × (average ascending rank − 1) ÷ (357 − 1). Equal values share the average rank. We reverse the pollution score, so lower exposure scores higher.
We average the two life-expectancy scores for health and the two economic scores for economy, then average all four category scores. Each category contributes 25%. These are declared editorial weights, not scientifically estimated shares of happiness.
Which areas are included?
We start with 361 non-overlapping UK local authority districts: 296 in England, 32 in Scotland, 22 in Wales and 11 in Northern Ireland. We join by official area code and require every input. Counties are not mixed with their constituent districts.
357 areas meet the data requirements. Missing or suppressed values are not filled with zeros or national averages. The exclusions below explain the remaining areas.
How much do weights matter?
We rerun the index eight times, halving or increasing one category’s weight by 50% and rescaling the total back to 100%. The table shows each area’s best and worst rank across those scenarios.
The download also includes four tests that omit one category and a comparison using min–max scaling. These describe sensitivity to the method, not sampling uncertainty.
What the index leaves out
We exclude crime, rent affordability and the former England-only clinical and access measures where a consistent UK comparison could not be established. Relationships, belonging, personal circumstances and many other influences on wellbeing are outside this index.
Higher scores do not prove people are happier or healthier individually. The ranking is descriptive and cannot establish that moving would improve someone’s wellbeing.
Excluded areas and data quality
Employment uses the same age range, ILO employment definition and calendar year across the UK. Great Britain uses the Annual Population Survey and Northern Ireland uses annual Labour Force Survey tables; sampling, weighting and precision differ. These limitations remain even with the matched period.
All six raw inputs are required. Missing or suppressed figures, source-explicit unreliable estimates and unharmonised boundary changes are excluded without imputation. Published ASHE pay with CV above 20% is excluded; accepted values can still be uncertain. Nine published workplace-pay estimates have CV above 10% and at most 20%, flagged in the download. Employment intervals are approximate 95% intervals where Nomis supplies them. NISRA does not publish district intervals in its table; all selected NI employment cells are unshaded. Life-expectancy intervals are retained. Close index ranks are not demonstrated to differ statistically, and methodological sensitivity ranges are not confidence intervals.
| Area | Country | Reason not ranked |
|---|---|---|
| Isles of Scilly | England | male life expectancy not published for this district; female life expectancy not published for this district; employment: Missing or source-suppressed employment rate; pay: missing, suppressed or unpublished median; pay: coefficient of variation unavailable for quality screening; pay: source flags estimate as unreliable or suppressed |
| Barnsley | England | employment: No matching employment estimate for the 2025 boundary; predecessor was not substituted; PM2.5: predecessor boundary is not harmonised to this current district |
| Sheffield | England | employment: No matching employment estimate for the 2025 boundary; predecessor was not substituted; PM2.5: predecessor boundary is not harmonised to this current district |
| City of London | England | male life expectancy not published for this district; female life expectancy not published for this district; employment: Missing or source-suppressed employment rate |
Explore our original England index.
A different edition, a different method. The July 2024 study below covered 123 selected English authorities and used 22 indicators across five categories. It is preserved for reference. Its scores and positions cannot be used to measure change against the new UK index.
Historical publisher study · July 2024The study combines economy, environment, health, safety and connectivity across 123 English local-authority areas. It used historical inputs, including 2021 Health Index data and earnings comparisons through 2023. Its scores are modelled index points, not direct happiness responses or percentages.
Search your area or explore the rankings. The underlying data has been preserved; the table has not been recalculated for 2026.
Search the full 123-area historical table
Scroll horizontally to see all five categories and the final score. Category scores were rescaled to 50–90.
| Rank | Area code | Local authority | Region | Connectivity | Economy | Environment | Health | Safety | Final score |
|---|---|---|---|---|---|---|---|---|---|
| 1 | E06000041 | Wokingham | South East | 76.89 | 87.72 | 65.79 | 81.26 | 87.25 | 79.782 |
| 2 | E06000017 | Rutland | East Midlands | 61.62 | 85.3 | 74.92 | 84.87 | 90 | 79.342 |
| 3 | E06000060 | Buckinghamshire | South East | 75.77 | 82.03 | 70.35 | 82.65 | 85.56 | 79.272 |
| 4 | E09000006 | Bromley | London | 82.75 | 76.89 | 70.36 | 84.8 | 79.87 | 78.934 |
| 5 | E08000009 | Trafford | North West | 84.82 | 77.87 | 73.59 | 77.92 | 80.18 | 78.876 |
| 6 | E06000056 | Central Bedfordshire | East of England | 75.84 | 81.54 | 69.97 | 82.93 | 83.99 | 78.854 |
| 7 | E06000011 | East Riding of Yorkshire | Yorkshire and The Humber | 73.33 | 82.28 | 80.11 | 74.2 | 84.13 | 78.81 |
| 8 | E06000037 | West Berkshire | South East | 73.54 | 90 | 70.3 | 74.68 | 85.37 | 78.778 |
| 9 | E06000022 | Bath and North East Somerset | South West | 81.43 | 78.46 | 75.24 | 74.61 | 84.13 | 78.774 |
| 10 | E08000007 | Stockport | North West | 84.3 | 77.23 | 71.16 | 79.87 | 80.3 | 78.572 |
| 11 | E06000024 | North Somerset | South West | 76.81 | 86.64 | 77.01 | 68.47 | 83.46 | 78.478 |
| 12 | E06000036 | Bracknell Forest | South East | 78.51 | 83.67 | 67.2 | 78.19 | 84.18 | 78.35 |
| 13 | E06000040 | Windsor and Maidenhead | South East | 80.69 | 78.76 | 64.53 | 84.17 | 83.47 | 78.324 |
| 14 | E06000025 | South Gloucestershire | South West | 79.5 | 85.25 | 70.16 | 74.21 | 82.37 | 78.298 |
| 15 | E09000015 | Harrow | London | 84.87 | 68.2 | 64.99 | 90 | 82.99 | 78.21 |
| 16 | E06000059 | Dorset | South West | 70.77 | 78.36 | 78.84 | 76.07 | 86.92 | 78.192 |
| 17 | E06000049 | Cheshire East | North West | 74.07 | 84.3 | 69.85 | 76.67 | 84.42 | 77.862 |
| 18 | E09000004 | Bexley | London | 84.66 | 74.83 | 68.59 | 79 | 81.64 | 77.744 |
| 19 | E09000016 | Havering | London | 82.21 | 74.93 | 69.45 | 81.59 | 80.52 | 77.74 |
| 20 | E06000014 | York | Yorkshire and The Humber | 80.97 | 85.46 | 79.54 | 61.64 | 81.08 | 77.738 |
| 21 | E06000007 | Warrington | North West | 80.76 | 83.11 | 74.9 | 71.25 | 78.4 | 77.684 |
| 22 | E06000013 | North Lincolnshire | Yorkshire and The Humber | 75.56 | 77.63 | 77.4 | 79.13 | 77.47 | 77.438 |
| 23 | E06000052 | Cornwall | South West | 69.49 | 77.31 | 79.43 | 72.13 | 86.82 | 77.036 |
| 24 | E08000034 | Kirklees | Yorkshire and The Humber | 82.87 | 72.05 | 76.14 | 75.49 | 78.26 | 76.962 |
| 25 | E09000021 | Kingston upon Thames | London | 85.31 | 77.22 | 62.97 | 78.12 | 80.39 | 76.802 |
| 26 | E08000015 | Wirral | North West | 83.47 | 77.28 | 76.13 | 63.08 | 81.36 | 76.264 |
| 27 | E08000027 | Dudley | West Midlands | 84.19 | 74.36 | 70.03 | 73.59 | 78.99 | 76.232 |
| 28 | E06000026 | Plymouth | South West | 81.06 | 78.84 | 75.55 | 66.83 | 78.74 | 76.204 |
| 29 | E08000008 | Tameside | North West | 84.35 | 74.36 | 69.52 | 75.15 | 77.36 | 76.148 |
| 30 | E06000020 | Telford and Wrekin | West Midlands | 77.11 | 80.47 | 80.18 | 64.56 | 78.32 | 76.128 |
| 31 | E08000002 | Bury | North West | 83.87 | 75.13 | 74.7 | 68.43 | 78.48 | 76.122 |
| 32 | E09000008 | Croydon | London | 85.44 | 69.03 | 66.66 | 81.9 | 77.22 | 76.05 |
| 33 | E09000027 | Richmond upon Thames | London | 86.76 | 66.6 | 64.43 | 82.5 | 79.41 | 75.94 |
| 34 | E06000057 | Northumberland | North East | 68.31 | 72.11 | 90 | 66.51 | 82.44 | 75.874 |
| 35 | E06000055 | Bedford | East of England | 78.92 | 73.06 | 72.46 | 78.93 | 75.94 | 75.862 |
| 36 | E08000033 | Calderdale | Yorkshire and The Humber | 80.94 | 77.53 | 78.56 | 65.16 | 77.08 | 75.854 |
| 37 | E08000026 | Coventry | West Midlands | 84.16 | 73.07 | 70.49 | 72.87 | 78.37 | 75.792 |
| 38 | E09000024 | Merton | London | 86.29 | 67.65 | 61.97 | 84.07 | 78.73 | 75.742 |
| 39 | E06000054 | Wiltshire | South West | 69.8 | 82.99 | 70.72 | 68.23 | 86.87 | 75.722 |
| 40 | E08000014 | Sefton | North West | 83.63 | 77.45 | 66.88 | 71.41 | 78.9 | 75.654 |
| 41 | E06000050 | Cheshire West and Chester | North West | 76.42 | 75.9 | 73.1 | 72.46 | 80.37 | 75.65 |
| 42 | E06000042 | Milton Keynes | South East | 79.06 | 81.82 | 67.91 | 71.3 | 77.5 | 75.518 |
| 43 | E08000010 | Wigan | North West | 83.06 | 79.72 | 70.27 | 67.01 | 77.36 | 75.484 |
| 44 | E08000019 | Sheffield | Yorkshire and The Humber | 82.88 | 68.41 | 74.85 | 73.02 | 77.97 | 75.426 |
| 45 | E06000008 | Blackburn with Darwen | North West | 84.59 | 70.36 | 78.54 | 67.3 | 75.75 | 75.308 |
| 46 | E06000051 | Shropshire | West Midlands | 58.13 | 73.43 | 81.98 | 76.46 | 85.33 | 75.066 |
| 47 | E06000046 | Isle of Wight | South East | 76.68 | 75.21 | 78.41 | 60.57 | 84.45 | 75.064 |
| 48 | E09000003 | Barnet | London | 85.78 | 63.04 | 62.21 | 84.82 | 79.27 | 75.024 |
| 49 | E06000012 | North East Lincolnshire | Yorkshire and The Humber | 81.59 | 78.58 | 71.63 | 73 | 69.55 | 74.87 |
| 50 | E06000058 | Bournemouth, Christchurch and Poole | South West | 80.77 | 78.06 | 73.23 | 66.24 | 75.77 | 74.814 |
| 51 | E06000034 | Thurrock | East of England | 79.54 | 69.13 | 67.29 | 82.63 | 75.24 | 74.766 |
| 52 | E08000036 | Wakefield | Yorkshire and The Humber | 80.75 | 77.56 | 77.35 | 65.51 | 72.56 | 74.746 |
| 53 | E08000001 | Bolton | North West | 84.6 | 67.49 | 73.73 | 71.25 | 76.47 | 74.708 |
| 54 | E06000030 | Swindon | South West | 78.08 | 77.81 | 67.53 | 69.11 | 80.07 | 74.52 |
| 55 | E08000037 | Gateshead | North East | 82.46 | 69.17 | 76.28 | 67.36 | 77.12 | 74.478 |
| 56 | E09000032 | Wandsworth | London | 87.84 | 79.27 | 54.27 | 81.59 | 68.69 | 74.332 |
| 57 | E08000018 | Rotherham | Yorkshire and The Humber | 82.24 | 70.52 | 72.64 | 66.9 | 79.27 | 74.314 |
| 58 | E08000016 | Barnsley | Yorkshire and The Humber | 82.08 | 73.7 | 77.79 | 59.39 | 78.6 | 74.312 |
| 59 | E09000017 | Hillingdon | London | 83.57 | 62.23 | 65.65 | 81.73 | 77.48 | 74.132 |
| 60 | E08000005 | Rochdale | North West | 83.17 | 66.91 | 74.68 | 71 | 74.29 | 74.01 |
| 61 | E08000004 | Oldham | North West | 84.1 | 64.41 | 71.14 | 73.92 | 76.14 | 73.942 |
| 62 | E08000029 | Solihull | West Midlands | 79.43 | 72.81 | 70.12 | 68.01 | 79.23 | 73.92 |
| 63 | E06000032 | Luton | East of England | 83.88 | 66.67 | 62.82 | 79.92 | 76.17 | 73.892 |
| 64 | E06000006 | Halton | North West | 81.06 | 80.85 | 69.37 | 63.29 | 74.47 | 73.808 |
| 65 | E09000029 | Sutton | London | 85.6 | 71.43 | 58.18 | 76.39 | 77.19 | 73.758 |
| 66 | E09000009 | Ealing | London | 85.16 | 61.63 | 63.16 | 84.77 | 73.71 | 73.686 |
| 67 | E08000032 | Bradford | Yorkshire and The Humber | 83.71 | 63.66 | 76.54 | 71.32 | 72.99 | 73.644 |
| 68 | E09000026 | Redbridge | London | 84.35 | 59.32 | 61.99 | 84.9 | 77.31 | 73.574 |
| 69 | E06000035 | Medway | South East | 82.32 | 75.02 | 70.92 | 68.2 | 71.27 | 73.546 |
| 70 | E06000033 | Southend-on-Sea | East of England | 84.38 | 67.65 | 68.62 | 72.85 | 73.83 | 73.466 |
| 71 | E09000025 | Newham | London | 86.57 | 66.8 | 57.84 | 87.03 | 69.08 | 73.464 |
| 72 | E06000047 | County Durham | North East | 77.6 | 68.28 | 81.76 | 63.17 | 76.24 | 73.41 |
| 73 | E09000023 | Lewisham | London | 84.68 | 69.02 | 62.55 | 79.51 | 70.11 | 73.174 |
| 74 | E09000010 | Enfield | London | 85.67 | 57.98 | 63.27 | 82.67 | 75.97 | 73.112 |
| 75 | E06000038 | Reading | South East | 83.15 | 78.36 | 67.28 | 65.25 | 70.96 | 73 |
| 76 | E06000019 | Herefordshire, County of | West Midlands | 50 | 77.75 | 79.56 | 71.3 | 86.24 | 72.97 |
| 77 | E09000018 | Hounslow | London | 84.98 | 63.73 | 62.54 | 78.65 | 74.57 | 72.894 |
| 78 | E08000017 | Doncaster | Yorkshire and The Humber | 80.73 | 69.42 | 77.47 | 65.07 | 71.74 | 72.886 |
| 79 | E06000005 | Darlington | North East | 76.83 | 72.48 | 80.78 | 58.29 | 75.52 | 72.78 |
| 80 | E06000021 | Stoke-on-Trent | West Midlands | 83.54 | 67.06 | 75.27 | 63.99 | 74.03 | 72.778 |
| 81 | E08000031 | Wolverhampton | West Midlands | 83.46 | 63.96 | 69.3 | 74.22 | 72.89 | 72.766 |
| 82 | E08000030 | Walsall | West Midlands | 81.39 | 66.17 | 65.44 | 73.54 | 76.54 | 72.616 |
| 83 | E08000013 | St. Helens | North West | 82.53 | 73.99 | 70.61 | 59.65 | 76.22 | 72.6 |
| 84 | E06000039 | Slough | South East | 84.17 | 71.85 | 61.36 | 72.79 | 72.11 | 72.456 |
| 85 | E08000035 | Leeds | Yorkshire and The Humber | 83.73 | 65.6 | 74.42 | 65.15 | 72.24 | 72.228 |
| 86 | E08000022 | North Tyneside | North East | 82.58 | 70.75 | 68.64 | 61.31 | 77.76 | 72.208 |
| 87 | E09000005 | Brent | London | 85.54 | 56.12 | 61.66 | 83.91 | 73.75 | 72.196 |
| 88 | E09000031 | Waltham Forest | London | 85.3 | 60.22 | 56.86 | 83.73 | 73.35 | 71.892 |
| 89 | E06000004 | Stockton-on-Tees | North East | 77.11 | 65.31 | 76.72 | 64.33 | 75.92 | 71.878 |
| 90 | E09000007 | Camden | London | 89.02 | 70.99 | 54 | 79.45 | 64.83 | 71.658 |
| 91 | E08000023 | South Tyneside | North East | 82.48 | 60.75 | 65.7 | 70.42 | 78.66 | 71.602 |
| 92 | E06000015 | Derby | East Midlands | 82.25 | 65.82 | 69.62 | 66.79 | 71.95 | 71.286 |
| 93 | E06000001 | Hartlepool | North East | 82.17 | 62.21 | 81.8 | 61.76 | 68.14 | 71.216 |
| 94 | E09000011 | Greenwich | London | 84.79 | 59.3 | 64.53 | 74.75 | 72.15 | 71.104 |
| 95 | E06000043 | Brighton and Hove | South East | 84.89 | 68.52 | 64.12 | 64.15 | 73.61 | 71.058 |
| 96 | E09000002 | Barking and Dagenham | London | 85.62 | 50.36 | 63.06 | 80.34 | 74.8 | 70.836 |
| 97 | E06000003 | Redcar and Cleveland | North East | 78.71 | 61.96 | 81.92 | 58.76 | 72.71 | 70.812 |
| 98 | E09000022 | Lambeth | London | 87.51 | 65.02 | 58.55 | 79.69 | 62.5 | 70.654 |
| 99 | E08000012 | Liverpool | North West | 83.78 | 67.31 | 69.65 | 59.24 | 72.28 | 70.452 |
| 100 | E08000021 | Newcastle upon Tyne | North East | 82.87 | 54.13 | 71.19 | 69.73 | 72.98 | 70.18 |
| 101 | E09000014 | Haringey | London | 86.36 | 59.88 | 61.17 | 78.45 | 65.02 | 70.176 |
| 102 | E09000030 | Tower Hamlets | London | 88.44 | 69.45 | 50 | 84.29 | 58.58 | 70.152 |
| 103 | E06000023 | Bristol, City of | South West | 83.7 | 66.55 | 69.75 | 59.64 | 70.76 | 70.08 |
| 104 | E08000003 | Manchester | North West | 83.97 | 59.65 | 67.46 | 68.46 | 70.61 | 70.03 |
| 105 | E08000006 | Salford | North West | 81.52 | 59.82 | 70.79 | 62.18 | 75.59 | 69.98 |
| 106 | E08000028 | Sandwell | West Midlands | 83.84 | 66.52 | 62.36 | 64.25 | 72.78 | 69.95 |
| 107 | E09000012 | Hackney | London | 86.87 | 73.05 | 57.41 | 76.89 | 54.99 | 69.842 |
| 108 | E09000019 | Islington | London | 89.24 | 67.23 | 55.47 | 75.31 | 60.53 | 69.556 |
| 109 | E06000016 | Leicester | East Midlands | 83.93 | 54.32 | 64.72 | 71.84 | 72.96 | 69.554 |
| 110 | E06000031 | Peterborough | East of England | 77.97 | 71.2 | 75.19 | 50 | 72.6 | 69.392 |
| 111 | E06000045 | Southampton | South East | 83.93 | 65.01 | 65.52 | 63.19 | 67.73 | 69.076 |
| 112 | E09000028 | Southwark | London | 87.34 | 65.79 | 56.81 | 69.84 | 64.83 | 68.922 |
| 113 | E08000024 | Sunderland | North East | 82.04 | 61.4 | 63.78 | 61.48 | 73.89 | 68.518 |
| 114 | E06000010 | Kingston upon Hull, City of | Yorkshire and The Humber | 84.25 | 70.1 | 70.35 | 56 | 60.12 | 68.164 |
| 115 | E08000025 | Birmingham | West Midlands | 82.32 | 52.24 | 61.51 | 71.38 | 73.15 | 68.12 |
| 116 | E08000011 | Knowsley | North West | 81.22 | 50.56 | 67.31 | 59.32 | 79.18 | 67.518 |
| 117 | E09000033 | Westminster | London | 90 | 64.33 | 50.73 | 80.25 | 50 | 67.062 |
| 118 | E06000044 | Portsmouth | South East | 85.26 | 71.45 | 55.13 | 60.28 | 61.85 | 66.794 |
| 119 | E09000020 | Kensington and Chelsea | London | 89.34 | 56.03 | 51.61 | 78.96 | 55.51 | 66.29 |
| 120 | E06000002 | Middlesbrough | North East | 81.51 | 50 | 73.92 | 61.14 | 64.25 | 66.164 |
| 121 | E09000013 | Hammersmith and Fulham | London | 87.9 | 64.7 | 58.76 | 60.24 | 57.81 | 65.882 |
| 122 | E06000018 | Nottingham | East Midlands | 83.62 | 50.16 | 66.55 | 56.12 | 69.29 | 65.148 |
| 123 | E06000009 | Blackpool | North West | 84.86 | 52.4 | 67.69 | 54.14 | 64.82 | 64.782 |
| Five highest scores | |
|---|---|
| Westminster | 90 |
| Kensington and Chelsea | 89.34 |
| Islington | 89.24 |
| Camden | 89.02 |
| Tower Hamlets | 88.44 |
| Five lowest scores | |
| Herefordshire, County of | 50 |
| Shropshire | 58.13 |
| Rutland | 61.62 |
| Northumberland | 68.31 |
| Cornwall | 69.49 |
| Five highest scores | |
|---|---|
| West Berkshire | 90 |
| Wokingham | 87.72 |
| North Somerset | 86.64 |
| York | 85.46 |
| Rutland | 85.3 |
| Five lowest scores | |
| Middlesbrough | 50 |
| Nottingham | 50.16 |
| Barking and Dagenham | 50.36 |
| Knowsley | 50.56 |
| Birmingham | 52.24 |
| Five highest scores | |
|---|---|
| Northumberland | 90 |
| Shropshire | 81.98 |
| Redcar and Cleveland | 81.92 |
| Hartlepool | 81.8 |
| County Durham | 81.76 |
| Five lowest scores | |
| Tower Hamlets | 50 |
| Westminster | 50.73 |
| Kensington and Chelsea | 51.61 |
| Camden | 54 |
| Wandsworth | 54.27 |
| Five highest scores | |
|---|---|
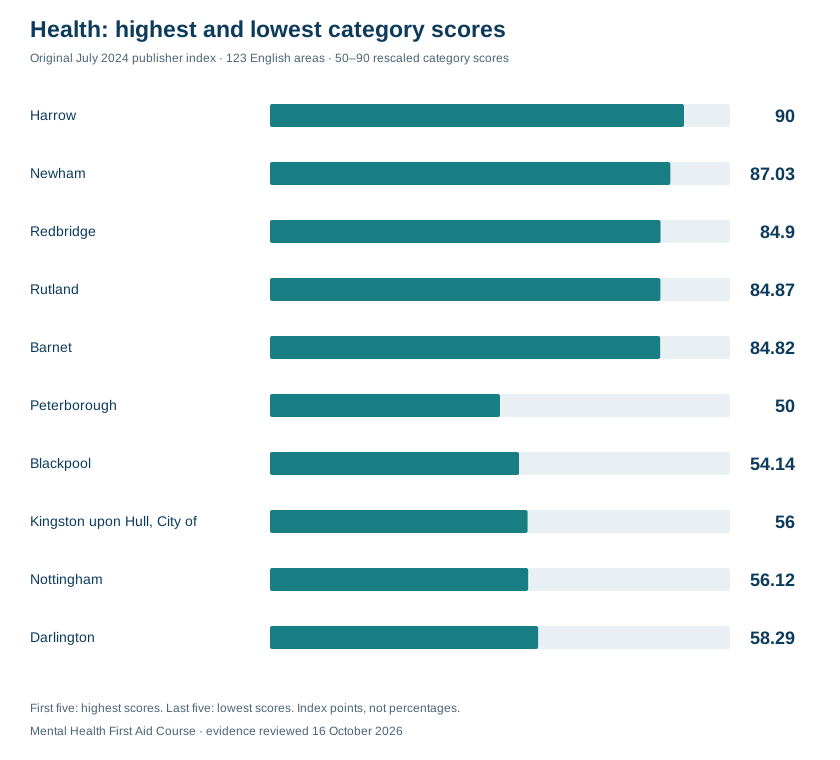
| Harrow | 90 |
| Newham | 87.03 |
| Redbridge | 84.9 |
| Rutland | 84.87 |
| Barnet | 84.82 |
| Five lowest scores | |
| Peterborough | 50 |
| Blackpool | 54.14 |
| Kingston upon Hull, City of | 56 |
| Nottingham | 56.12 |
| Darlington | 58.29 |
| Five highest scores | |
|---|---|
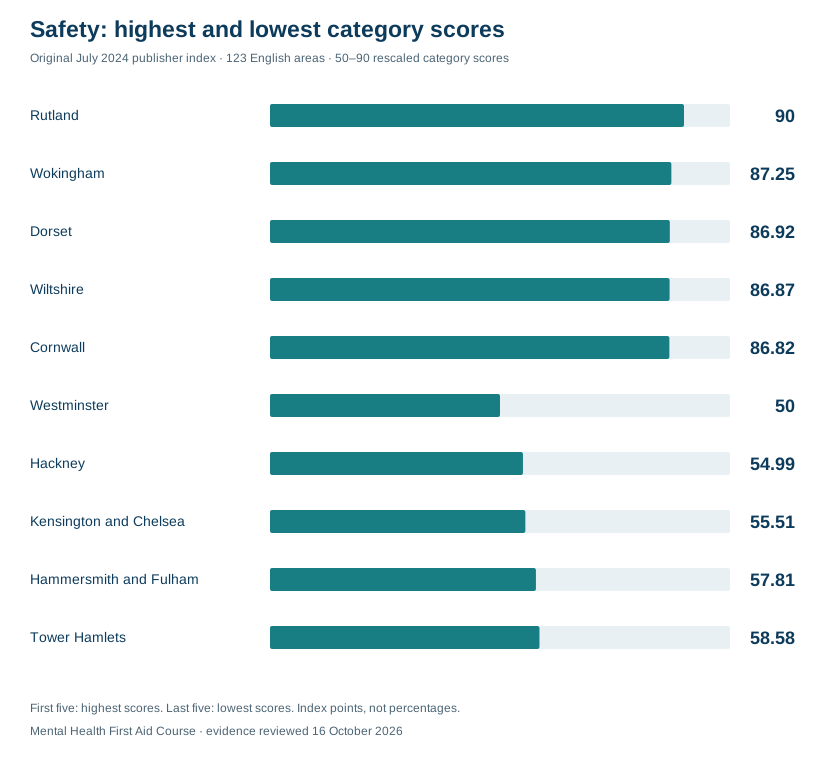
| Rutland | 90 |
| Wokingham | 87.25 |
| Dorset | 86.92 |
| Wiltshire | 86.87 |
| Cornwall | 86.82 |
| Five lowest scores | |
| Westminster | 50 |
| Hackney | 54.99 |
| Kensington and Chelsea | 55.51 |
| Hammersmith and Fulham | 57.81 |
| Tower Hamlets | 58.58 |
A rescaled score of 90 does not mean 90% happiness. Dividing 90 by 50 does not show that one area is 1.8 times happier, healthier or safer. The health category describes selected population-health indicators; it does not rate healthcare providers.
Read the complete historical area profiles and original methodology
Choosing a place to live isn't just about finding a house. It's about discovering a community that supports your well-being.
Economic conditions, safety, health, the environment and access to services can all be relevant to wellbeing. Combining selected indicators creates one way to compare places, but it does not directly measure how happy every resident feels.
This article preserves our original July 2024 composite ranking of 123 English local-authority areas. Its source list identifies 2021 Health Index data and earnings inputs from 2020–2023. It is a historical publisher study, not an official ranking or a new assessment of happiness in 2026.
The index combines five categories: economy, environment, health, safety and connectivity. The categories use selected indicators such as earnings, life expectancy, pollution, crime and access to services. Scores depend on the chosen measures, weights and rescaling, rather than representing percentages or direct units of happiness.
The original rankings and category scores are retained below. They describe the areas in the study using its historical inputs; they do not establish current local conditions, rate healthcare providers or prove that a place causes better mental health.
Key Findings
- Wokingham ranked first in this publisher index (79.78), followed by Rutland (79.34) and Buckinghamshire (79.27).
- Blackpool ranked last in this index (64.78), followed by Nottingham (65.14) and Hammersmith and Fulham (65.88).
- Category scores were rescaled to run from 50 to 90. The endpoints do not mean the highest-scoring area is 1.8 times happier, healthier or safer.
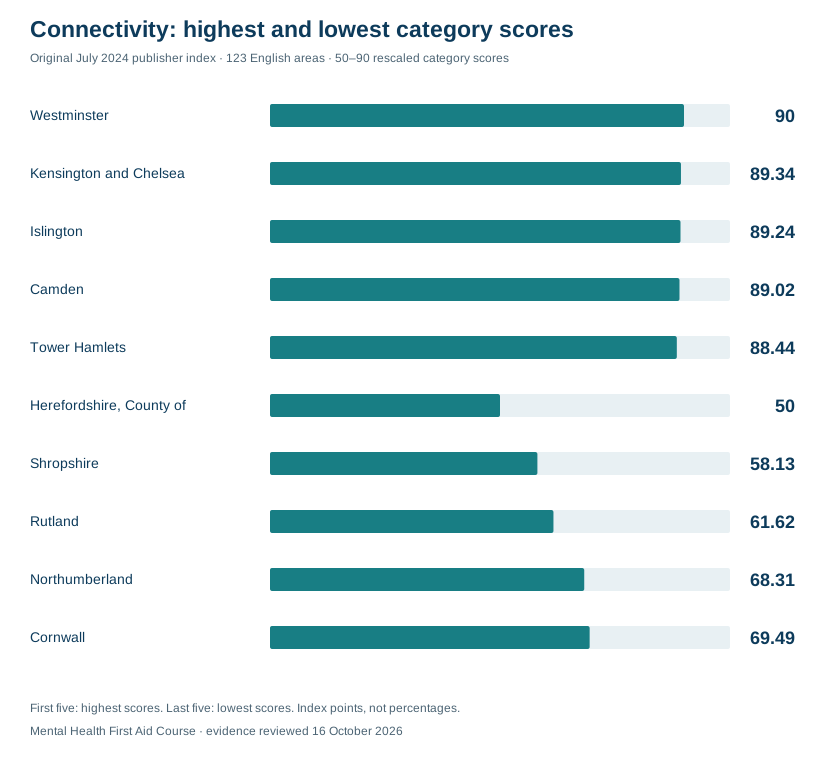
- Westminster takes the lead in connectivity (90), and Herefordshire (50) comes in last.
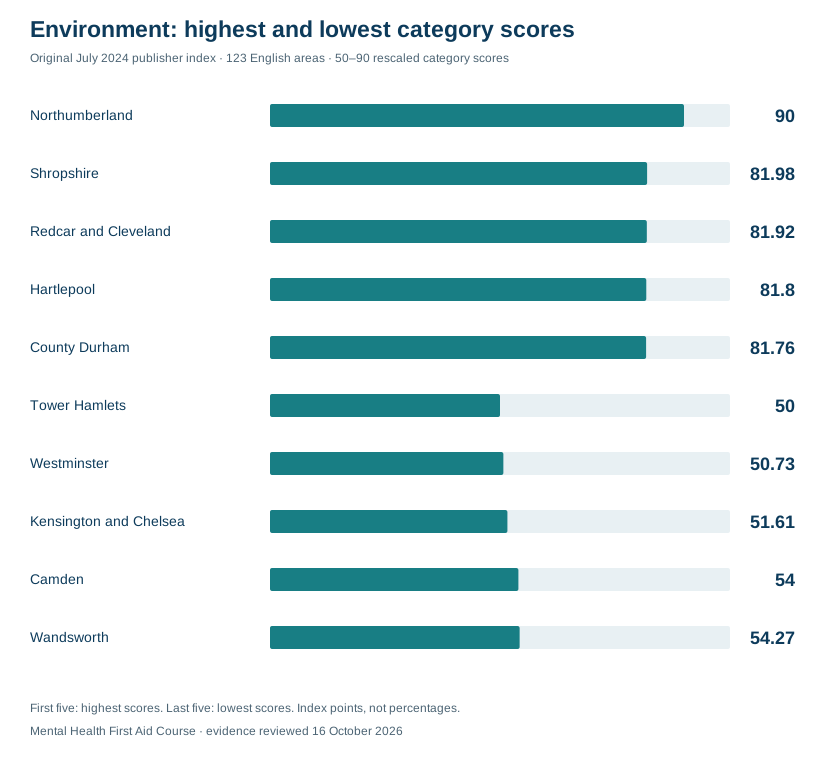
- Northumberland has the best environmental score (90), while Tower Hamlets has the worst (50).
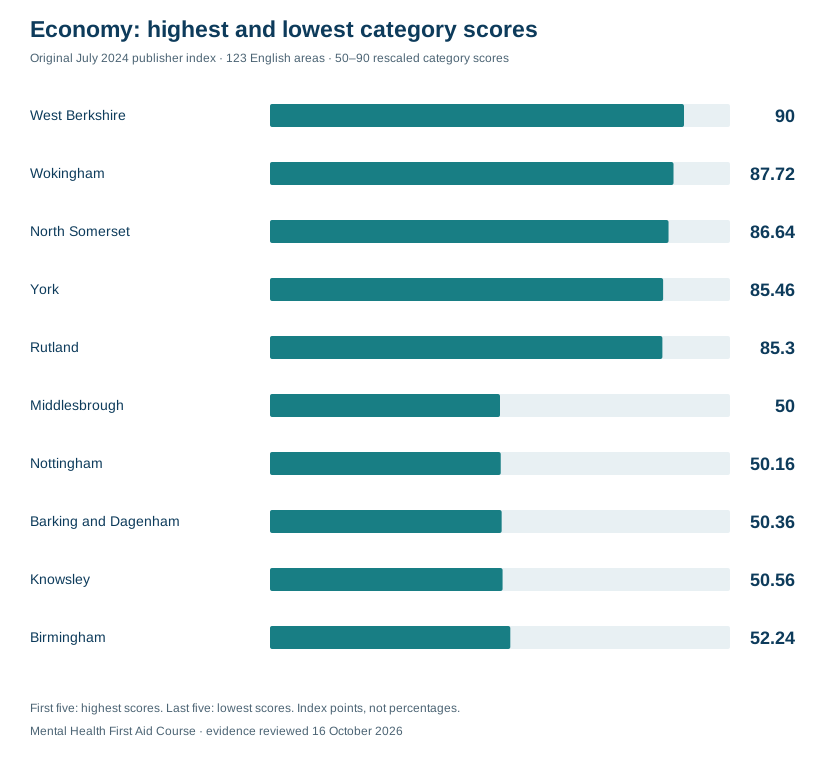
- The economic rankings place West Berkshire (90) in first place and Middlesbrough (50) in last.
- Harrow (90) holds the top spot for health in the rankings, with Peterborough (50) ranking last.
- Rutland (90) leads in safety, while Westminster (50) is at the bottom.
- Westminster has the highest connectivity score (90), and the lowest safety score (50).
- Rutland has the highest safety score (90), and the third-lowest connectivity score (61.62).
- Shropshire has the second-best environment score (81.98) and the second-worst connectivity score (58.13).
Original Composite Ranking: English Areas
20 Highest-Scoring Areas in the Original Index
1. Wokingham
Wokingham ranked 1 in the highest-scoring group in the original publisher index, with an overall score of 79.782. Its published category scores were connectivity 76.89, economy 87.72, environment 65.79, health 81.26 and safety 87.25. These are historical composite scores, not current measures of residents’ happiness.
Wokingham’s profile reflects the measures and weights selected for this study. The health category combines population-health indicators; it does not measure healthcare-provider quality. Access and environmental averages can also conceal differences between neighbourhoods and individual households.
2. Rutland
Rutland ranked 2 in the highest-scoring group in the original publisher index, with an overall score of 79.342. Its published category scores were connectivity 61.62, economy 85.3, environment 74.92, health 84.87 and safety 90. These are historical composite scores, not current measures of residents’ happiness.
Rutland’s profile reflects the measures and weights selected for this study. The health category combines population-health indicators; it does not measure healthcare-provider quality. Access and environmental averages can also conceal differences between neighbourhoods and individual households.
3. Buckinghamshire
Buckinghamshire ranked 3 in the highest-scoring group in the original publisher index, with an overall score of 79.272. Its published category scores were connectivity 75.77, economy 82.03, environment 70.35, health 82.65 and safety 85.56. These are historical composite scores, not current measures of residents’ happiness.
Buckinghamshire’s profile reflects the measures and weights selected for this study. The health category combines population-health indicators; it does not measure healthcare-provider quality. Access and environmental averages can also conceal differences between neighbourhoods and individual households.
4. Bromley
Bromley ranked 4 in the highest-scoring group in the original publisher index, with an overall score of 78.934. Its published category scores were connectivity 82.75, economy 76.89, environment 70.36, health 84.8 and safety 79.87. These are historical composite scores, not current measures of residents’ happiness.
5. Trafford
Trafford ranked 5 in the highest-scoring group in the original publisher index, with an overall score of 78.876. Its published category scores were connectivity 84.82, economy 77.87, environment 73.59, health 77.92 and safety 80.18. These are historical composite scores, not current measures of residents’ happiness.
6. Central Bedfordshire
Central Bedfordshire ranked 6 in the highest-scoring group in the original publisher index, with an overall score of 78.854. Its published category scores were connectivity 75.84, economy 81.54, environment 69.97, health 82.93 and safety 83.99. These are historical composite scores, not current measures of residents’ happiness.
7. East Riding of Yorkshire
East Riding of Yorkshire ranked 7 in the highest-scoring group in the original publisher index, with an overall score of 78.81. Its published category scores were connectivity 73.33, economy 82.28, environment 80.11, health 74.2 and safety 84.13. These are historical composite scores, not current measures of residents’ happiness.
8. West Berkshire
West Berkshire ranked 8 in the highest-scoring group in the original publisher index, with an overall score of 78.778. Its published category scores were connectivity 73.54, economy 90, environment 70.3, health 74.68 and safety 85.37. These are historical composite scores, not current measures of residents’ happiness.
West Berkshire’s profile reflects the measures and weights selected for this study. The health category combines population-health indicators; it does not measure healthcare-provider quality. Access and environmental averages can also conceal differences between neighbourhoods and individual households.
9. Bath and North East Somerset
Bath and North East Somerset ranked 9 in the highest-scoring group in the original publisher index, with an overall score of 78.774. Its published category scores were connectivity 81.43, economy 78.46, environment 75.24, health 74.61 and safety 84.13. These are historical composite scores, not current measures of residents’ happiness.
10. Stockport
Stockport ranked 10 in the highest-scoring group in the original publisher index, with an overall score of 78.572. Its published category scores were connectivity 84.3, economy 77.23, environment 71.16, health 79.87 and safety 80.3. These are historical composite scores, not current measures of residents’ happiness.
11. North Somerset
North Somerset ranked 11 in the highest-scoring group in the original publisher index, with an overall score of 78.478. Its published category scores were connectivity 76.81, economy 86.64, environment 77.01, health 68.47 and safety 83.46. These are historical composite scores, not current measures of residents’ happiness.
12. Bracknell Forest
Bracknell Forest ranked 12 in the highest-scoring group in the original publisher index, with an overall score of 78.35. Its published category scores were connectivity 78.51, economy 83.67, environment 67.2, health 78.19 and safety 84.18. These are historical composite scores, not current measures of residents’ happiness.
13. Windsor and Maidenhead
Windsor and Maidenhead ranked 13 in the highest-scoring group in the original publisher index, with an overall score of 78.324. Its published category scores were connectivity 80.69, economy 78.76, environment 64.53, health 84.17 and safety 83.47. These are historical composite scores, not current measures of residents’ happiness.
14. South Gloucestershire
South Gloucestershire ranked 14 in the highest-scoring group in the original publisher index, with an overall score of 78.298. Its published category scores were connectivity 79.5, economy 85.25, environment 70.16, health 74.21 and safety 82.37. These are historical composite scores, not current measures of residents’ happiness.
15. Harrow
Harrow ranked 15 in the highest-scoring group in the original publisher index, with an overall score of 78.21. Its published category scores were connectivity 84.87, economy 68.2, environment 64.99, health 90 and safety 82.99. These are historical composite scores, not current measures of residents’ happiness.
16. Dorset
Dorset ranked 16 in the highest-scoring group in the original publisher index, with an overall score of 78.192. Its published category scores were connectivity 70.77, economy 78.36, environment 78.84, health 76.07 and safety 86.92. These are historical composite scores, not current measures of residents’ happiness.
17. Cheshire East
Cheshire East ranked 17 in the highest-scoring group in the original publisher index, with an overall score of 77.862. Its published category scores were connectivity 74.07, economy 84.3, environment 69.85, health 76.67 and safety 84.42. These are historical composite scores, not current measures of residents’ happiness.
18. Bexley
Bexley ranked 18 in the highest-scoring group in the original publisher index, with an overall score of 77.744. Its published category scores were connectivity 84.66, economy 74.83, environment 68.59, health 79 and safety 81.64. These are historical composite scores, not current measures of residents’ happiness.
19. Havering
Havering ranked 19 in the highest-scoring group in the original publisher index, with an overall score of 77.74. Its published category scores were connectivity 82.21, economy 74.93, environment 69.45, health 81.59 and safety 80.52. These are historical composite scores, not current measures of residents’ happiness.
20. York
York ranked 20 in the highest-scoring group in the original publisher index, with an overall score of 77.738. Its published category scores were connectivity 80.97, economy 85.46, environment 79.54, health 61.64 and safety 81.08. These are historical composite scores, not current measures of residents’ happiness.
20 Lowest-Scoring Areas in the Original Index
1. Blackpool
Blackpool ranked 1 from the bottom in the original publisher index, with an overall score of 64.782. Its published category scores were connectivity 84.86, economy 52.4, environment 67.69, health 54.14 and safety 64.82. These are historical composite scores, not current measures of residents’ happiness.
2. Nottingham
Nottingham ranked 2 from the bottom in the original publisher index, with an overall score of 65.148. Its published category scores were connectivity 83.62, economy 50.16, environment 66.55, health 56.12 and safety 69.29. These are historical composite scores, not current measures of residents’ happiness.
3. Hammersmith and Fulham
Hammersmith and Fulham ranked 3 from the bottom in the original publisher index, with an overall score of 65.882. Its published category scores were connectivity 87.9, economy 64.7, environment 58.76, health 60.24 and safety 57.81. These are historical composite scores, not current measures of residents’ happiness.
4. Middlesbrough
Middlesbrough ranked 4 from the bottom in the original publisher index, with an overall score of 66.164. Its published category scores were connectivity 81.51, economy 50, environment 73.92, health 61.14 and safety 64.25. These are historical composite scores, not current measures of residents’ happiness.
Middlesbrough’s profile reflects the measures and weights selected for this study. The health category combines population-health indicators; it does not measure healthcare-provider quality. Access and environmental averages can also conceal differences between neighbourhoods and individual households.
5. Kensington and Chelsea
Kensington and Chelsea ranked 5 from the bottom in the original publisher index, with an overall score of 66.29. Its published category scores were connectivity 89.34, economy 56.03, environment 51.61, health 78.96 and safety 55.51. These are historical composite scores, not current measures of residents’ happiness.
Kensington and Chelsea’s profile reflects the measures and weights selected for this study. The health category combines population-health indicators; it does not measure healthcare-provider quality. Access and environmental averages can also conceal differences between neighbourhoods and individual households.
6. Portsmouth
Portsmouth ranked 6 from the bottom in the original publisher index, with an overall score of 66.794. Its published category scores were connectivity 85.26, economy 71.45, environment 55.13, health 60.28 and safety 61.85. These are historical composite scores, not current measures of residents’ happiness.
Portsmouth’s profile reflects the measures and weights selected for this study. The health category combines population-health indicators; it does not measure healthcare-provider quality. Access and environmental averages can also conceal differences between neighbourhoods and individual households.
7. Westminster
Westminster ranked 7 from the bottom in the original publisher index, with an overall score of 67.062. Its published category scores were connectivity 90, economy 64.33, environment 50.73, health 80.25 and safety 50. These are historical composite scores, not current measures of residents’ happiness.
8. Knowsley
Knowsley ranked 8 from the bottom in the original publisher index, with an overall score of 67.518. Its published category scores were connectivity 81.22, economy 50.56, environment 67.31, health 59.32 and safety 79.18. These are historical composite scores, not current measures of residents’ happiness.
9. Birmingham
Birmingham ranked 9 from the bottom in the original publisher index, with an overall score of 68.12. Its published category scores were connectivity 82.32, economy 52.24, environment 61.51 and health 71.38. These are historical composite scores, not current measures of residents’ happiness.
10. Kingston upon Hull
Kingston upon Hull ranked 10 from the bottom in the original publisher index, with an overall score of 68.164. Its published category scores were connectivity 84.25, economy 70.1, environment 70.35, health 56 and safety 60.12. These are historical composite scores, not current measures of residents’ happiness.
11. Sunderland
Sunderland ranked 11 from the bottom in the original publisher index, with an overall score of 68.518. Its published category scores were connectivity 82.04, economy 61.4, environment 63.78, health 61.48 and safety 73.89. These are historical composite scores, not current measures of residents’ happiness.
12. Southwark
Southwark ranked 12 from the bottom in the original publisher index, with an overall score of 68.922. Its published category scores were connectivity 87.34, economy 65.79, environment 56.81, health 69.84 and safety 64.83. These are historical composite scores, not current measures of residents’ happiness.
13. Southampton
Southampton ranked 13 from the bottom in the original publisher index, with an overall score of 69.076. Its published category scores were connectivity 83.93, economy 65.01, environment 65.52, health 63.19 and safety 67.73. These are historical composite scores, not current measures of residents’ happiness.
Southampton’s profile reflects the measures and weights selected for this study. The health category combines population-health indicators; it does not measure healthcare-provider quality. Access and environmental averages can also conceal differences between neighbourhoods and individual households.
14. Peterborough
Peterborough ranked 14 from the bottom in the original publisher index, with an overall score of 69.392. Its published category scores were connectivity 77.97, economy 71.2, environment 75.19, health 50 and safety 72.6. These are historical composite scores, not current measures of residents’ happiness.
15. Leicester
Leicester ranked 15 from the bottom in the original publisher index, with an overall score of 69.554. Its published category scores were connectivity 83.93, economy 54.32, environment 64.72, health 71.84 and safety 72.96. These are historical composite scores, not current measures of residents’ happiness.
16. Islington
Islington ranked 16 from the bottom in the original publisher index, with an overall score of 69.556. Its published category scores were connectivity 89.24, economy 67.23, environment 55.47, health 75.31 and safety 60.53. These are historical composite scores, not current measures of residents’ happiness.
17. Hackney
Hackney ranked 17 from the bottom in the original publisher index, with an overall score of 69.842. Its published category scores were connectivity 86.87, economy 73.05, environment 57.41 and safety 54.99. These are historical composite scores, not current measures of residents’ happiness.
18. Sandwell
Sandwell ranked 18 from the bottom in the original publisher index, with an overall score of 69.95. Its published category scores were connectivity 83.84, economy 66.52, environment 62.36, health 64.25 and safety 72.78. These are historical composite scores, not current measures of residents’ happiness.
19. Salford
Salford ranked 19 from the bottom in the original publisher index, with an overall score of 69.98. Its published category scores were connectivity 81.52, economy 59.82, environment 70.79, health 62.18 and safety 75.59. These are historical composite scores, not current measures of residents’ happiness.
Salford’s profile reflects the measures and weights selected for this study. The health category combines population-health indicators; it does not measure healthcare-provider quality. Access and environmental averages can also conceal differences between neighbourhoods and individual households.
20. Manchester
Manchester ranked 20 from the bottom in the original publisher index, with an overall score of 70.03. Its published category scores were connectivity 83.97, economy 59.65, environment 67.46, health 68.46 and safety 70.61. These are historical composite scores, not current measures of residents’ happiness.
Connectivity: Top 5 vs Bottom 5 Areas
Westminster scored 90 and Herefordshire scored 50 on this rescaled category. These are the chosen endpoints of the index, not a 1.8-fold difference in the underlying outcomes.
Westminster had the highest connectivity score in this study, 90. The historical inputs reported median distances to GP services, pharmacies and leisure facilities of 0.53 km, 0.36 km and 0.34 km respectively, and 0.02% of premises unable to receive 10 Mbit/s broadband. These measures do not guarantee service availability for every resident.
Herefordshire had the lowest connectivity score, 50. The study reported median distances of 2.75 km to GP services, 4.42 km to pharmacies and 1.09 km to leisure facilities, with 4.19% of premises unable to receive 10 Mbit/s broadband. These are historical inputs, not current coverage or travel-time estimates.
Economy: Top 5 vs Bottom 5 Areas
West Berkshire scored 90 and Middlesbrough scored 50 on this rescaled category. These are the chosen endpoints of the index, not a 1.8-fold difference in the underlying outcomes.
West Berkshire scored 90 for economy. The study’s historical inputs included median hourly pay of £20.88, pay growth of 22.18% between 2020 and 2023, a sustained education/employment measure of 96.26% and an unemployment measure of 2.99%. Different indicators refer to different populations and periods; these are not current wage or employment estimates.
Middlesbrough scored 50 for economy. The study reported median hourly pay of £15.13, pay growth of 8.46% between 2020 and 2023, a sustained education/employment measure of 88.84% and unemployment of 7.25%. These retained historical inputs do not establish current job prospects for an individual.
Environment: Top 5 vs Bottom 5 Areas
Northumberland scored 90 and Tower Hamlets scored 50 on this rescaled category. These are the chosen endpoints of the index, not a 1.8-fold difference in the underlying outcomes.
Northumberland scored 90 for environment. Historical inputs reported in the study were a population-weighted annual mean PM2.5 concentration of 5.08 µg/m³, 2.64 noise complaints per 1,000 people and 2% overcrowded households. An index score of 90 means the highest rescaled score among the areas studied, not a perfect environment.
Tower Hamlets scored 50 for environment, with reported historical inputs of 9.48 µg/m³ for population-weighted annual mean PM2.5, 25.54 noise complaints per 1,000 people and 12.70% overcrowded households. These indicators describe different environmental and housing conditions, rather than one direct pollution rate.
Health: Top 5 vs Bottom 5 Areas
Harrow scored 90 and Peterborough scored 50 on this rescaled category. These are the chosen endpoints of the index, not a 1.8-fold difference in the underlying outcomes.
Harrow scored 90 for health in the original index. Inputs from the 2021 Health Index dataset included life expectancy of 83.96 years, mean life satisfaction of 7.69 and an age-standardised emergency self-harm admission rate of 89.16 per 100,000. Its age-standardised suicide rate was 5.4 per 100,000 for 2019–2021. The blood-pressure input, 17.91%, is a weighted GP Patient Survey measure based on respondents reporting high blood pressure, not a count of all residents with hypertension. Underlying observation periods vary; this composite does not rate healthcare facilities.
Peterborough scored 50 for health. Inputs from the 2021 Health Index dataset included life expectancy of 80.55 years and mean life satisfaction of 7.27. Its age-standardised suicide rate was 11.2 per 100,000 for 2019–2021. The blood-pressure input, 56.85%, is the dataset’s weighted GP Patient Survey measure, with received surveys as its denominator; it is not evidence that 56.85% of all residents had high blood pressure. These historical population and survey measures do not establish healthcare-provider quality.
Safety: Top 5 vs Bottom 5 Areas
Rutland scored 90 and Westminster scored 50 on this rescaled category. These are the chosen endpoints of the index, not a 1.8-fold difference in the underlying outcomes.
Rutland scored 90 for safety. Historical inputs reported in the study were 1.51 low-level crimes and 23.57 personal crimes per 1,000 people, plus 0.11 reported road crashes per km². These use different denominators and are not interchangeable measures of an individual’s safety.
Westminster scored 50 for safety. The study reported 12.54 low-level crimes and 75.83 personal crimes per 1,000 people, plus 53.25 reported road crashes per km². Area-based counts and resident-population rates need care in places with large commuter and visitor populations; the score is not a direct measure of how safe residents feel.
Conclusion
This index compares selected historical indicators across 123 English areas. It cannot establish a causal connection between a place and residents’ happiness, or show that changes in an index score will produce a particular improvement in mental health.
The results can be read as one published comparison, alongside direct wellbeing surveys and more recent local information. The rankings depend on the data available, indicator definitions, weights and rescaling choices. They should not be used as a current official league table of the best or worst places to live.
Methodology
The original methodology ranks 123 English local-authority areas using five categories. The areas include boroughs, unitary authorities and counties; they are not 123 counties or states. The categories are:
- Health : This category focuses on factors impacting the physical and mental well-being of residents.
- Economy : This category focuses on factors that influence the financial stability and economic circumstances measured for the area.
- Safety : This category focuses on factors that impact the overall security and well-being of residents.
- Connectivity : This category focuses on factors that influence the ease and efficiency of transportation and communication for residents.
- Environment : This category focuses on factors that impact the natural surroundings and overall environmental quality for residents
Data Acquisition and Normalization
The study combined historical indicators from several sources. Its source list identifies the 2021 Health Index dataset, with earnings comparisons through 2023. The Health Index’s underlying observation periods vary by indicator. The original method describes transforming inputs to a common 40–100 scale before weighting; the transformed values are index points, not percentages.
Scoring and Weighting
Each category combines selected metrics with weights chosen by the publisher. Such choices are judgements about the model, not scientifically established shares of happiness. Different weights or indicator definitions can change the rankings; the original weighting table is retained below.
Calculating the Final Score
- The original category calculation involved:
- Normalizing the individual data points within the category.
- Multiplying each normalized value by its corresponding weight.
- Summing the weighted values.
- The original method then rescales category scores to a 50–90 range and combines them into an overall score. A score of 90 is the upper endpoint of this scale, not 90% happiness; dividing 90 by 50 does not yield a meaningful ratio of wellbeing.
- Areas are ordered by the resulting composite score. The table preserves the original results rather than recalculating them with current data.
Methodology: Further Details

What can these rankings tell us about happiness?
The index shows where the selected local conditions look more or less favourable when considered together. A place can score well in one category and poorly in another: clean air, for example, does not guarantee strong broadband availability or high earnings.
Our direct ONS survey chart answers a different question about how people felt on the previous day. Keeping the two views separate lets readers distinguish reported feelings from the conditions we have chosen to analyse.
Area averages conceal differences between neighbourhoods and people. Small score gaps and exact positions should be read alongside the original figures, the weighting tests and the limitations. The index is a starting point for understanding local wellbeing, not a diagnosis of an area or its residents.
Questions about the UK rankings.
Where ranks highest in your UK wellbeing index?
Fareham has the highest score among the 357 areas included in our UK Wellbeing Conditions Index 2026. The result combines four categories of official data and does not establish that its residents report the highest happiness.
Which area ranks lowest?
East Lindsey has the lowest score under our stated method. This is a relative result for selected local conditions; it does not mean that everyone living there is unhappy.
Does this cover the whole UK?
It includes all four nations. We assessed all 361 local authority districts and could rank 357 with all required inputs. Excluded areas and reasons are published in the methods section.
Is 2024 really the latest data?
For some measures, yes. The latest local life-expectancy release covers 2022–2024. The latest ready-made population-weighted council air-pollution table covers 2024; newer 2025 grids require a different aggregation and are not the same local-authority series. Other inputs have later reference periods. The table above records each date and choice.
What does happiness yesterday mean?
It is the ONS question about how happy someone felt the previous day, answered from 0 to 10. The country average is not the percentage of people who are happy and does not measure satisfaction with the local area.
Can I compare these ranks with the original England study?
No. The new UK index has different indicators, geography, weights and scaling. The July 2024 England study remains available as a historical edition, not a like-for-like baseline.
Download the data behind the story.
The full results include raw values, category scores, UK and country ranks, quality notes and sensitivity checks. Cite this analysis for our index and the original providers for the underlying figures.
Mental Health First Aid Course (2026). UK Wellbeing Conditions Index 2026. Original analysis of official local-area data; availability checked 16 October 2026. https://www.mentalhealthfirstaidcourse.co.uk/blog/most-and-least-happiest-areas-to-live-in-england
Sources
Official underlying datasets and methods. Availability checked 16 October 2026; data periods and release dates are listed above. Sources for the separate historical study are retained.
- ONS: local-authority district to country lookup, April 2025
- ONS: local-area life expectancy, 2022–2024
- ONS/Nomis: Annual Population Survey employment rates
- NISRA: local-government-district annual employment tables, 2025
- ONS: Annual Population Survey quality update, September 2026
- Nomis: approximate confidence intervals and small-sample publication rules
- Defra: population-weighted local-authority PM2.5 data
- Defra: 2024 local-authority PM2.5 CSV
- Defra: newer 2025 modelled grids, a different data product
- Ofcom: Connected Nations update, Spring 2026
- Ofcom: fixed-broadband coverage methodology
- ONS: quarterly personal wellbeing, non-seasonally adjusted
- ONS: quarterly personal-wellbeing quality tables
- ONS: Barnsley boundary change
- ONS: Sheffield boundary change
- NISRA: workplace ASHE, 2025 provisional
- ONS: workplace ASHE, 2025 provisional
- ONS: August 2026 statistical designation
- ONS: annual local-area wellbeing estimates, latest 2022/23
- ONS: personal wellbeing quality and methodology
- Scottish Government: neighbourhood trust and loneliness 2025
- Welsh Government: National Survey 2024/25 quality and geographic limits
- Northern Ireland: Individual Wellbeing 2024/25
- Northern Ireland: Individual Wellbeing 2024/25 quality report
- Original England study: ONS
- Original England study: NOMIS
- Original England study: ONS
- Original publisher ranking: July 2024 data table
- Original publisher methodology: indicator weights
- ONS annual personal wellbeing publication and pause notice
- ONS personal wellbeing: frequently asked questions
- Original July 2024 England composite index: published data